PromQL, Prometheus’s query language, uses labels to identify time series data. While labels are crucial for data organization, there are scenarios where you need to omit certain labels from your query results. This process can significantly improve query performance and simplify data visualization.
In this guide, you'll learn various techniques to omit labels in PromQL, optimize your Grafana dashboards, and explore how modern monitoring solutions like SigNoz can streamline label management.
Understanding PromQL Labels and their Importance
PromQL (Prometheus Query Language) is the powerful query language used in Prometheus, a popular open-source monitoring and alerting system. At the heart of PromQL are labels—key-value pairs that uniquely identify time series. Labels in PromQL are key-value pairs attached to time series data.
For example:
http_requests_total{method="GET", status="200"}
Here, method and status are labels that differentiate metrics within the http_requests_total series.
Labels serve several critical functions in Prometheus:
- Identification: Labels uniquely identify time series within a metric name.
- Filtering: You can use labels to filter and select specific sets of time series.
- Grouping: Labels allow you to group related time series for aggregation operations.
- Context: They provide additional context about the source and nature of the metric data.
Why You Might Need to Omit Labels from Series Results
While labels are invaluable for data organization, there are scenarios where omitting certain labels becomes necessary or beneficial:
- Query Performance: Excessive labels can slow down query execution, especially when dealing with high-cardinality data.
- Data Visualization: Too many labels can clutter graphs and dashboards, making it difficult to focus on the most relevant information.
- Aggregation Clarity: When performing aggregations, some labels may become irrelevant or misleading in the resulting dataset.
- Resource Optimization: Reducing the number of labels can decrease the storage and processing requirements for your monitoring system.
- Simplified Analysis: Fewer labels can make it easier to spot trends and patterns in your data without distracting details.
You can optimize query performance, reduce system load, and maintain clean, focused dashboards by strategically omitting labels.
Techniques to Omit Labels in PromQL
PromQL offers several methods to omit labels from your query results. Let's explore the most common and effective techniques:
Using the without Clause
The without clause allows you to exclude specific labels from the result set.
Syntax:
<aggregation-operation> without (<labels to omit>) (<metric>)
Example:
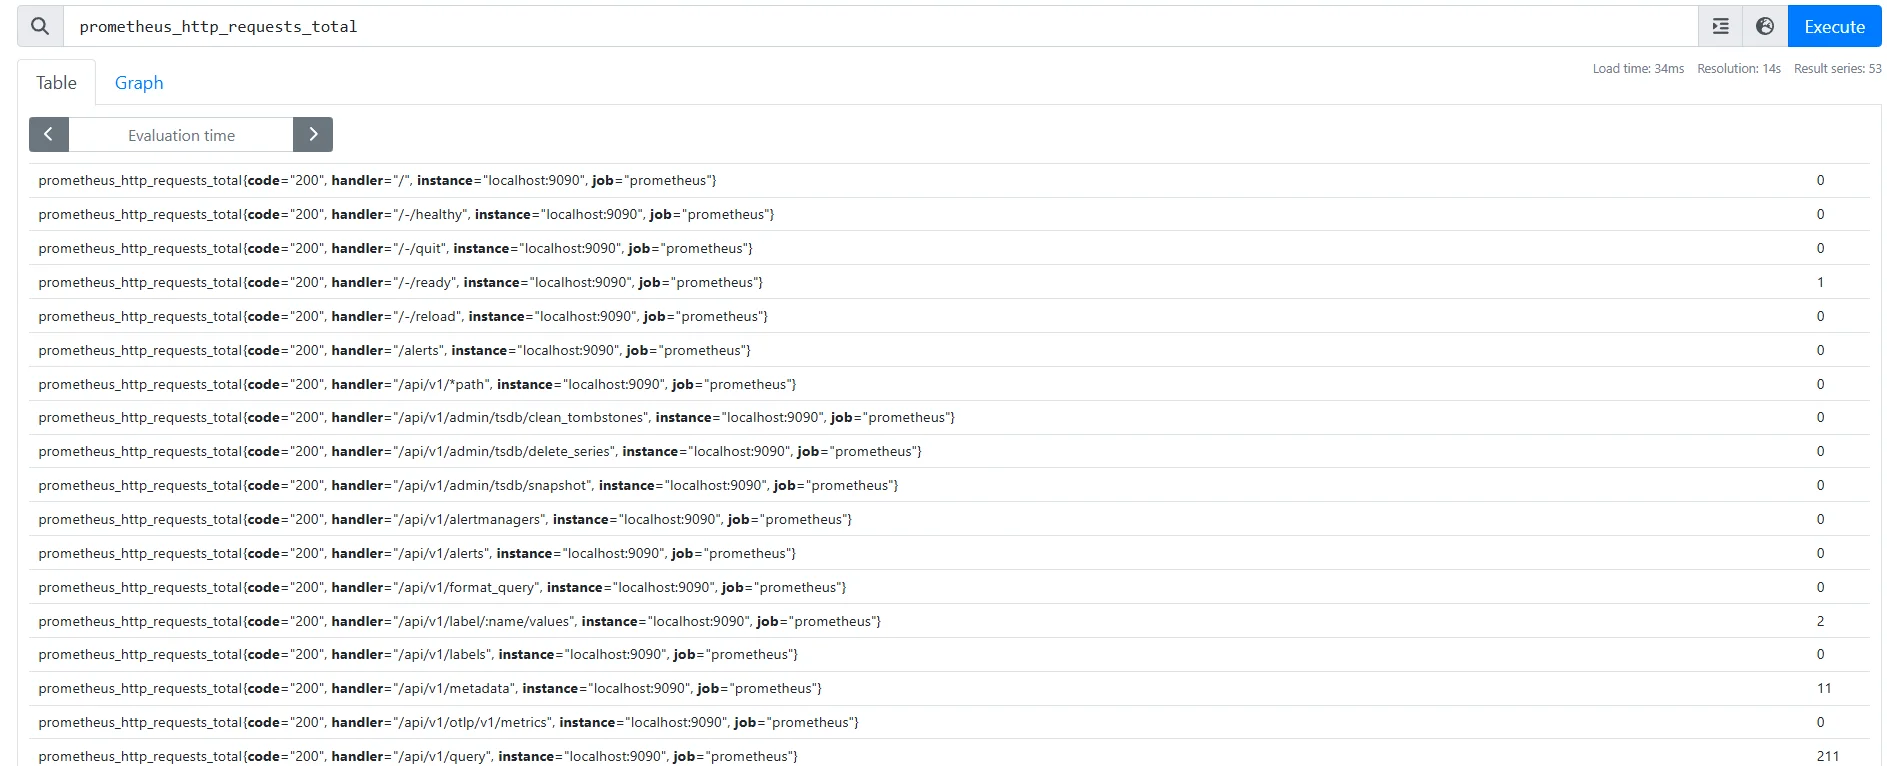
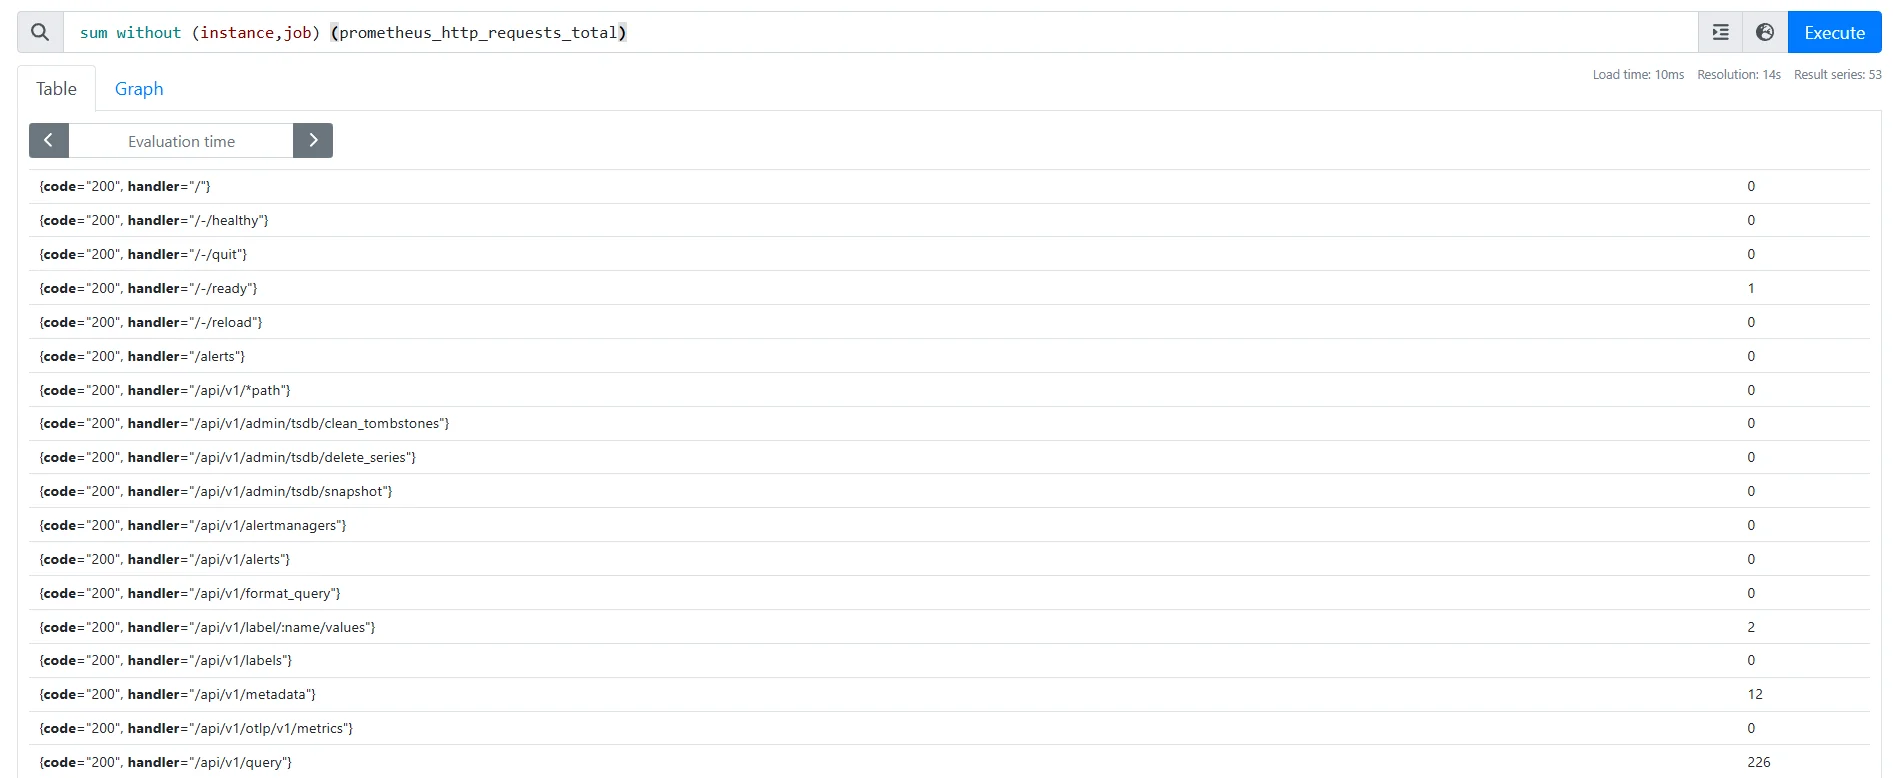
sum without (instance,job) (prometheus_http_requests_total)
This query sums up all HTTP requests but removes the instance and job labels from the result.
Leveraging the by Clause
The by clause is the opposite of without — it specifies which labels to keep.
Syntax:
<aggregation-operation> by (<labels to keep>) (<metric>)
Example:
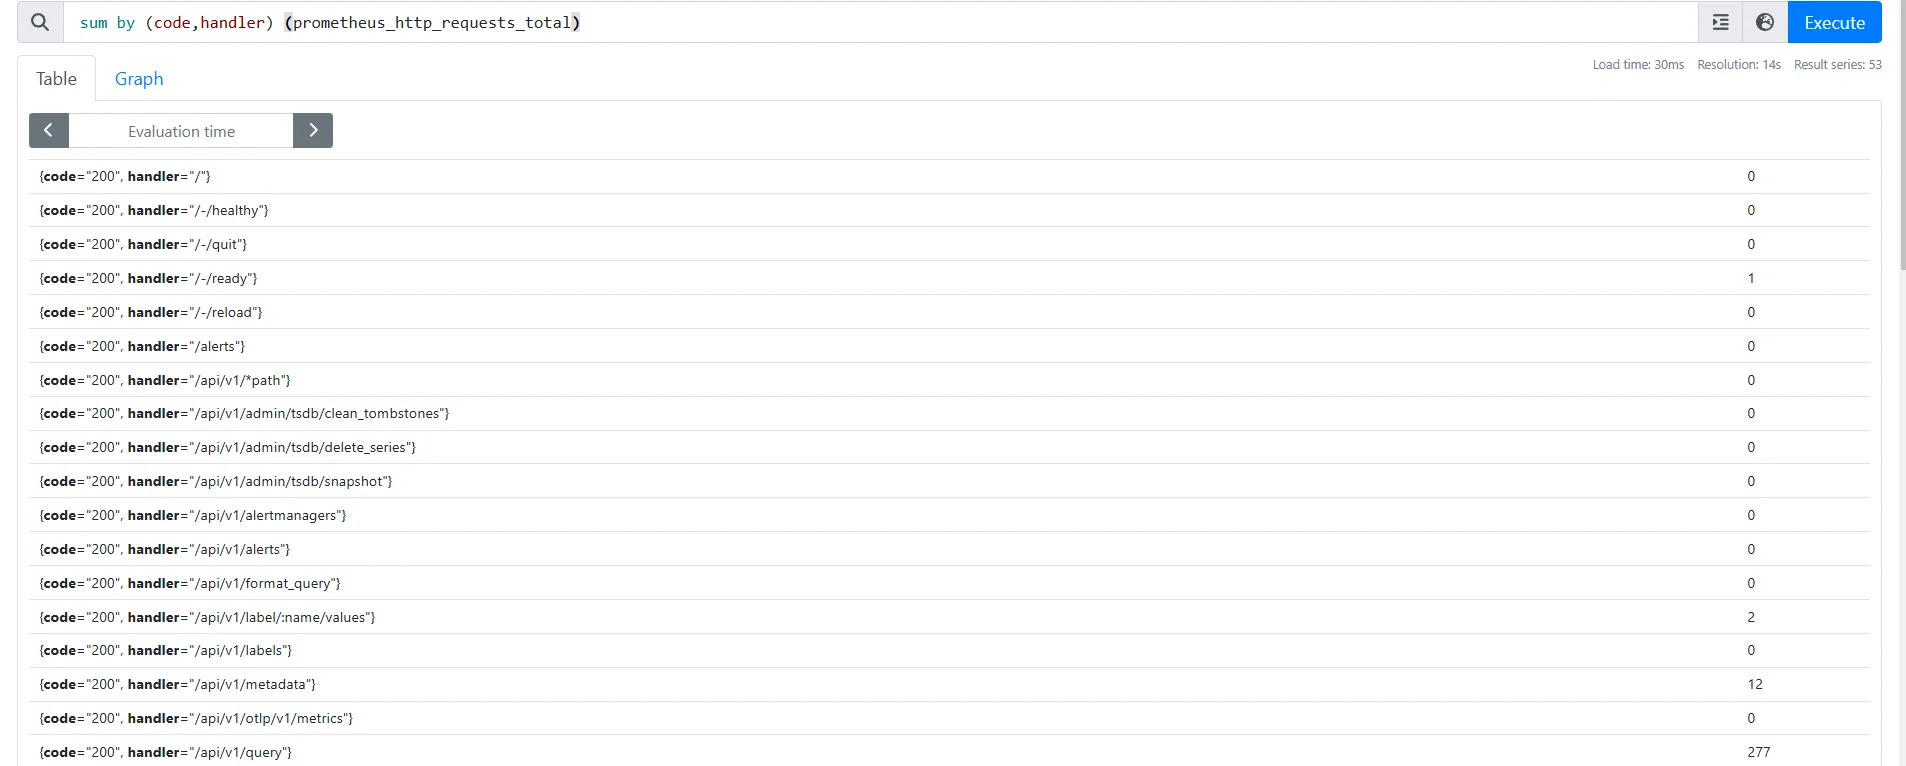
sum by (code,handler) (prometheus_http_requests_total)
This query retains only the method and status_code labels, effectively omitting all others.
Manipulating Labels with label_replace
When you need to modify or create labels in PromQL, label_replace is a versatile function. It allows you to transform label values or generate new labels based on existing ones.
The syntax of label_replace is:
label_replace(vector, "new_label", "replacement", "source_label", "regex")
vector: The input metric or query.new_label: The name of the new label to create or modify.replacement: The value assigned tonew_label, which can include parts ofsource_labelcaptured by the regex.source_label: The label whose value will be used for the transformation.regex: A regular expression to match the desired part of thesource_label.
Suppose you have a metric up with a label instance, and you want to create a new label called new_label that copies the value from instance. Use:
label_replace(up, "new_label", "$1", "instance", "(.*)")
What it does:
up- The input vector/metric to be modified"new_label"- This specifies the name of the new label to be created (or replaced if it already exists)"$1"- The value to assign to thenew_label. Here,$1refers to the first (and only) captured group in the regular expression"instance"- The existing/source label from which the value is extracted. The operation looks at theinstancelabel in theupmetric for matching"(.*)”- A regular expression pattern used to match the value of theinstancelabel.*matches the entire value of the label- The parentheses
()define a capture group, so the entire matched value becomes the first group ($1), which is used as the replacement value fornew_label


Note: By default, label_replace adds a new label without removing the old one.
To remove the old label (instance in this example) after using label_replace, you can pair it with the without or by clauses to exclude unwanted labels.
Example:
sum without (instance) (label_replace(up, "new_label", "$1", "instance", "(.*)"))
label_replace(up, "new_label", "$1", "instance", "(.*)"): Creates the new labelnew_labelby copying the value from theinstancelabelwithout (instance): Excludes the originalinstancelabel from the result

Let's walk through a practical example of omitting instance and pod labels from a Kubernetes deployment metric:
sum without (instance, pod) (kube_deployment_spec_replicas)
This query:
- Selects the
kube_deployment_spec_replicasmetric - Sums up the values across all series
- Removes the
instanceandpodlabels from the result
The output will show the total number of desired replicas for each deployment, without the noise of individual instance and pod information.
Advanced Label Manipulation in PromQL
For more complex scenarios, PromQL offers advanced techniques for label manipulation:
Regex-based Label Selection
You can use regular expressions to select or exclude labels based on patterns:
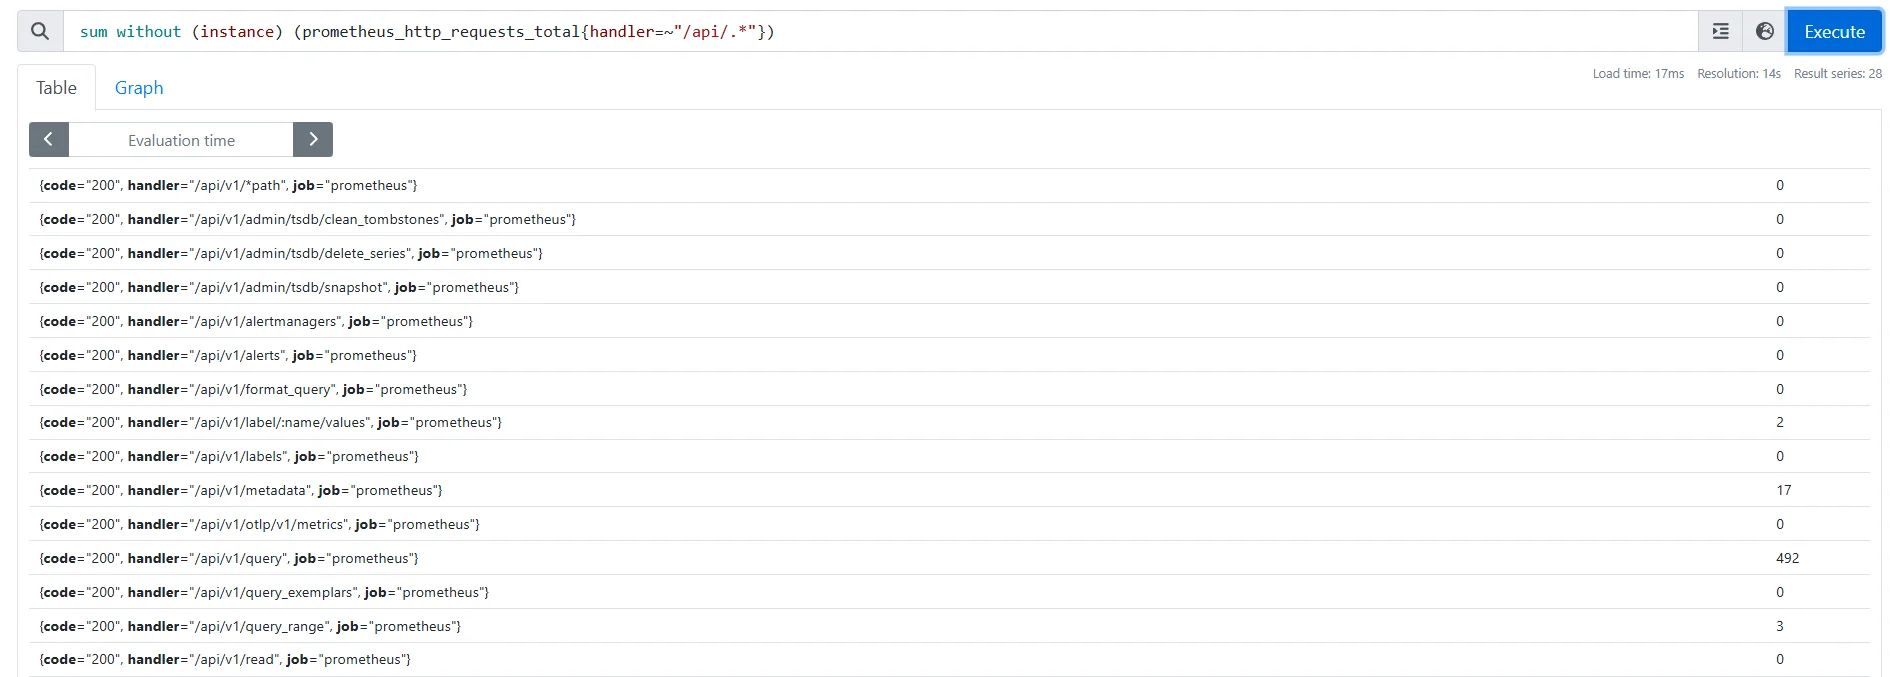
sum without (instance) (prometheus_http_requests_total{handler=~"/api/.*"})
This query sums up HTTP requests for all handlers starting with "/api" and removes the instance label.
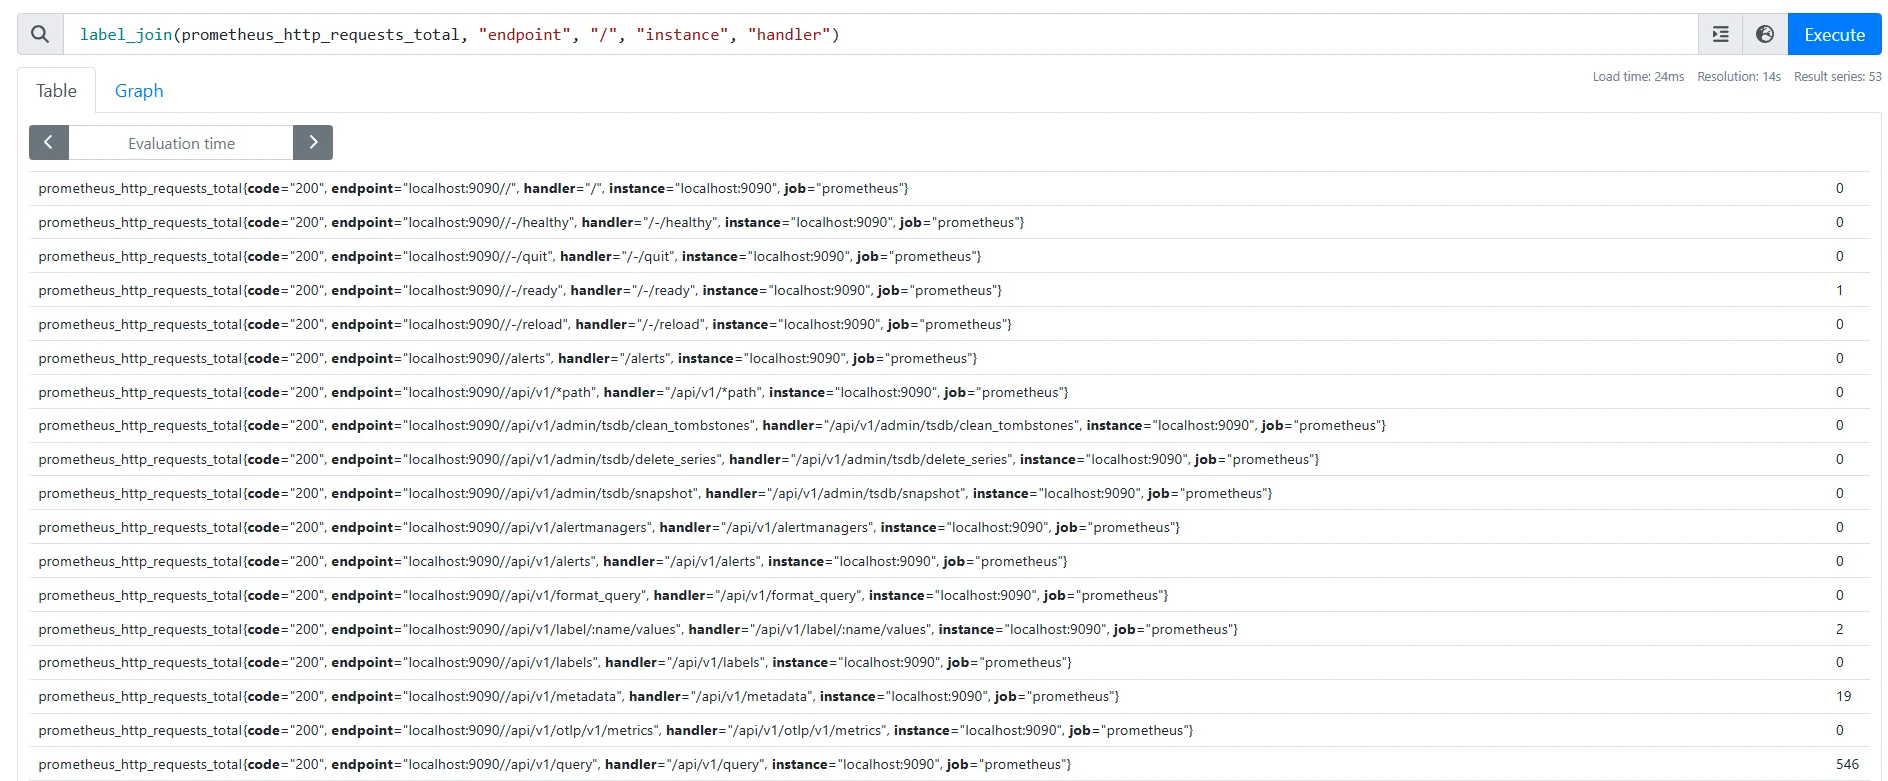
Label Joins for Combining labels
The label_join function in PromQL is used to combine multiple label values into a single label, using a specified separator. This is particularly useful when you need to create consolidated labels for easier filtering or grouping.
Syntax
label_join(vector, "dst_label", "separator", "src_label_1", "src_label_2", ...)
vector: The input metric or query.dst_label: The name of the destination label to create or modify.separator: A string used to separate the values.src_label_1,src_label_2, ...: The source labels whose values will be joined.
Example:
label_join(prometheus_http_requests_total, "endpoint", "/", "instance", "handler")
This query combines the instance and handler labels into a new endpoint label, separated by a /.
Best Practices for Label Omission
When omitting labels, keep these best practices in mind:
- Maintain Context: Ensure that omitting labels doesn't remove critical context from your data.
- Document Decisions: Keep track of which labels you're omitting and why, especially for complex queries.
- Balance Performance and Clarity: Strive for a balance between query performance and result clarity.
- Consistent Naming: Use consistent label names across your metrics to make omission patterns more predictable.
Optimizing Grafana Dashboards with Label Omission
Grafana, a popular visualization tool often used with Prometheus, can benefit greatly from strategic label omission:
Streamline Legend Entries: Use PromQL to omit unnecessary labels, resulting in cleaner legends:
sum by (code) (rate(prometheus_http_requests_total[5m]))This query shows request rates by status code, omitting other labels for a concise legend.
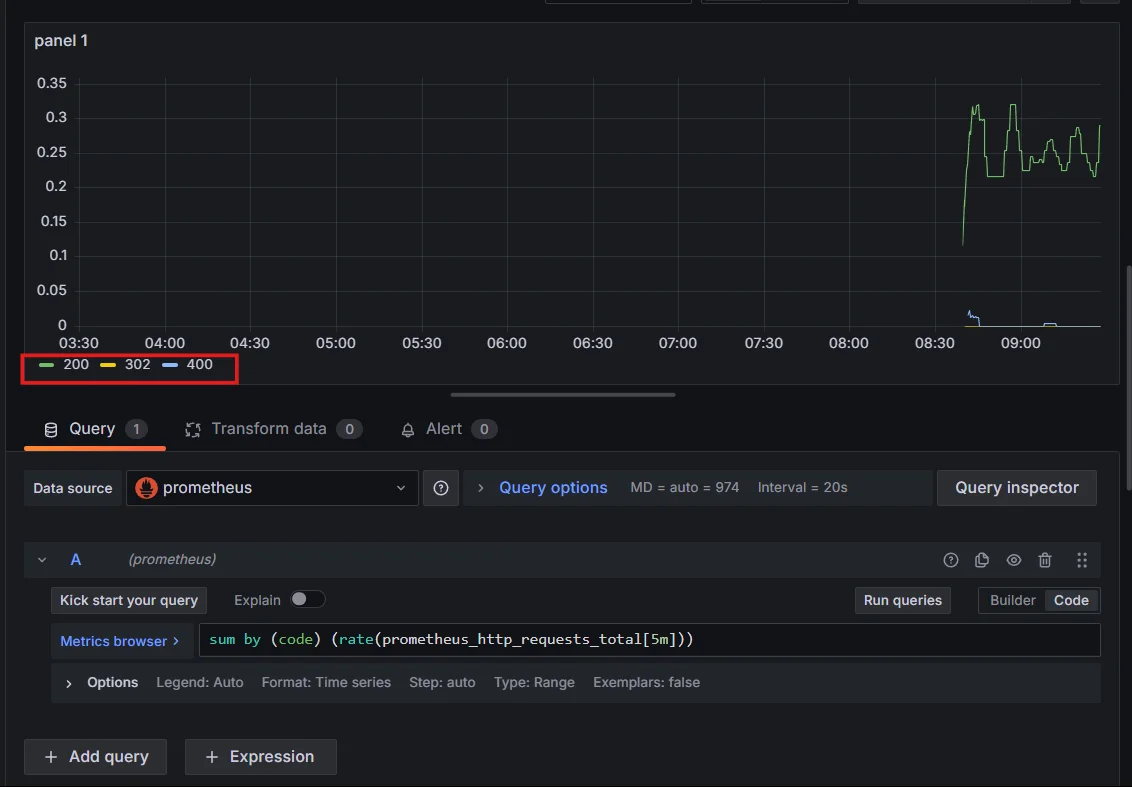
Streamline Legend Entries Utilize Grafana's Label Filters: Complement PromQL label omission with Grafana's built-in label filters for dynamic visualizations.
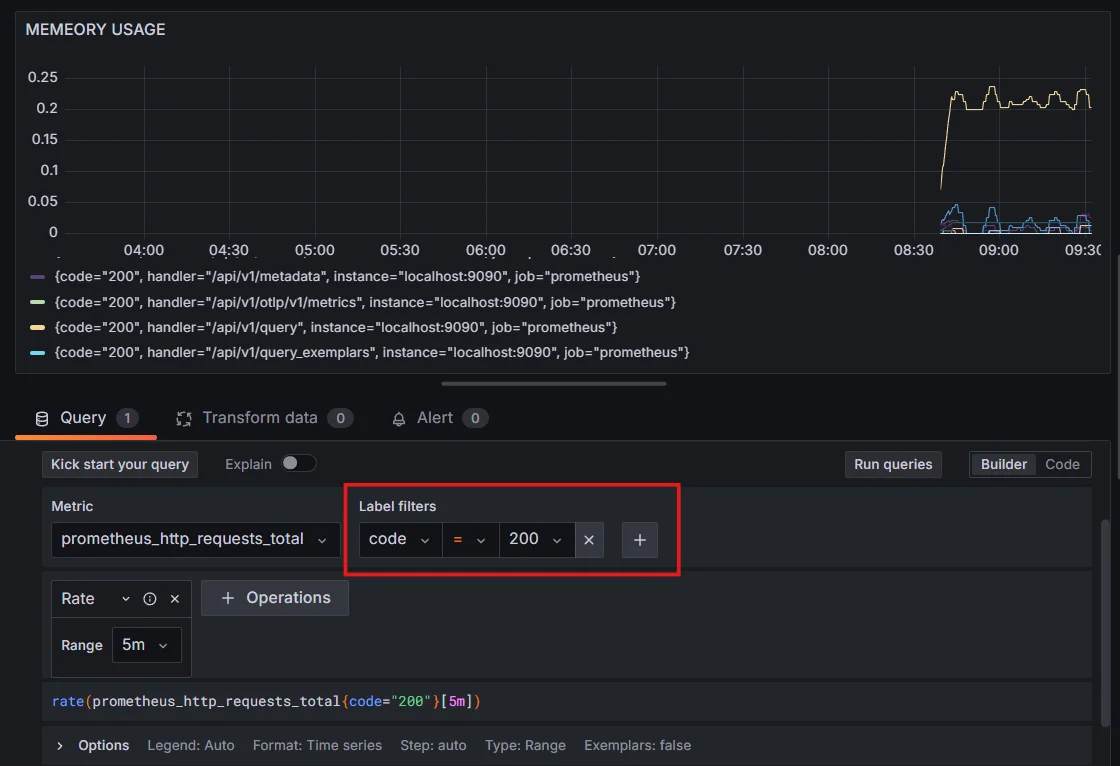
Utilize Grafana's Label Filters Create Template Variables: Use Grafana template variables to allow users to select which label values to include or exclude dynamically. Check out the steps for creating a template variable in Grafana.

Create Template Variables
Tips for Creating Clear and Concise Visualizations
When creating visualizations, the goal is to present data in a way that is both easy to understand and actionable. Follow these steps to create clear and concise visualizations:
- Focus on Key Metrics: Highlight the most relevant metrics for your use case, omitting less critical ones.
- Group Data Effectively: Use meaningful labels for grouping, like
regionorservice, to improve readability. - Leverage Color Coding: Assign consistent colors for recurring labels across panels to enhance visual clarity.
Monitoring with SigNoz: Simplified Label Management
In traditional monitoring setups, Prometheus and Grafana are commonly used for collecting metrics and visualizing data. However, for more complex, distributed systems, managing labels in Prometheus can become cumbersome, especially when you have many different metrics across microservices.
SigNoz offers a modern alternative that simplifies label management, aggregation, and visualization of metrics, traces, and logs, making it a great choice for teams looking to streamline their observability stack.
SigNoz, a modern open-source monitoring solution, offers enhanced capabilities for label management in distributed systems:
Automatic Context Propagation: SigNoz automatically propagates relevant labels across services, reducing the need for manual label management.
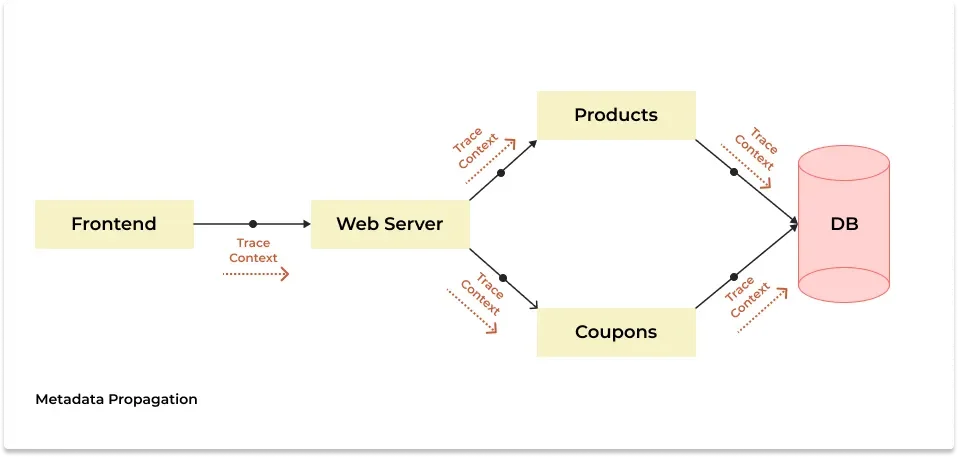
Automatic Context Propagation: SigNoz Intelligent Aggregation: SigNoz provides intelligent aggregation features by offering automatic grouping of metrics and traces based on common attributes (like service, region, etc.).
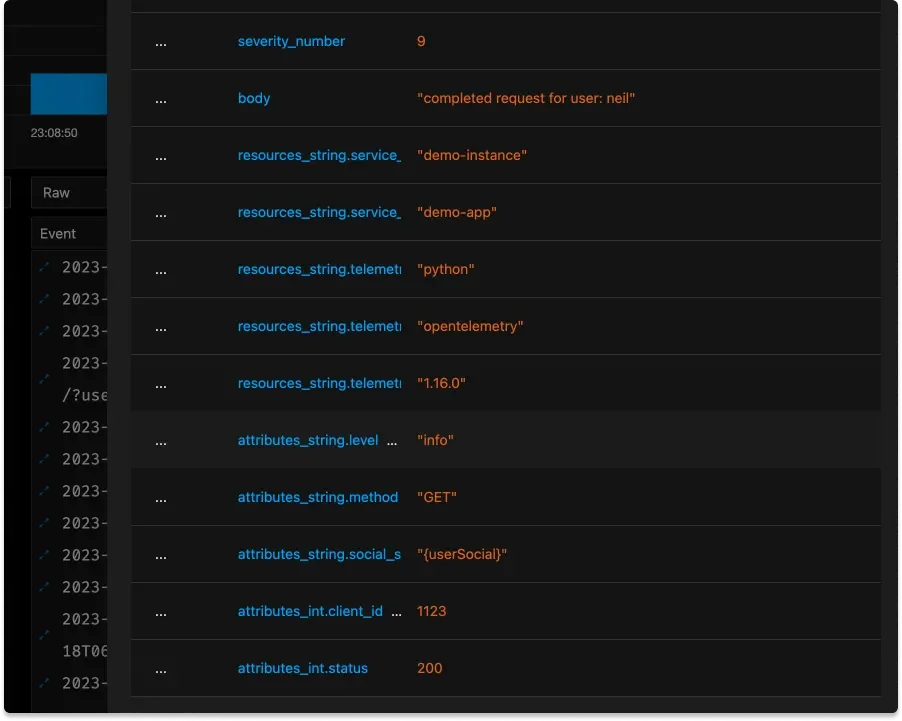
Custom Attribute Mapping: SigNoz allows you to map custom attributes to labels, giving you fine-grained control over what information is included in your metrics.
Custom Attribute Mapping: SigNoz
To get started with SigNoz and experience its simplified label management:
SigNoz cloud is the easiest way to run SigNoz. Sign up for a free account and get 30 days of unlimited access to all features.
You can also install and self-host SigNoz yourself since it is open-source. With 19,000+ GitHub stars, open-source SigNoz is loved by developers. Find the instructions to self-host SigNoz.
Key Takeaways
- Label omission in PromQL is crucial for query optimization and data clarity.
- Use
withoutandbyclauses to control which labels appear in your results. - Advanced techniques like regex-based selection and label joins offer powerful label manipulation options.
- Optimize Grafana dashboards by strategically omitting labels for cleaner visualizations.
- Consider modern solutions like SigNoz for more intuitive and efficient label management in complex systems.
FAQs
What is the difference between 'without' and 'by' clauses in PromQL?
The without clause specifies which labels to remove from the result, while the by clause specifies which labels to keep. For example:
without(label1, label2)removeslabel1andlabel2from the result.by(label3, label4)keeps onlylabel3andlabel4, removing all other labels.
Can I permanently remove labels from metrics in Prometheus?
No, you cannot permanently remove labels from metrics stored in Prometheus. Label omission is done at query time and does not affect the underlying stored data. To permanently change labels, you would need to modify the data at the collection point or use relabeling configurations.
How does label omission affect alerting rules?
Label omission in alerting rules can impact which alerts are fired and how they are grouped. Be cautious when omitting labels in alerting queries to ensure you don't lose the critical context needed for proper alert routing and resolution.
Are there performance implications when using complex label manipulation in PromQL?
Yes, complex label manipulations can impact query performance, especially on large datasets. Operations like regex-based label selection or extensive use of label join operations may increase query execution time. It's important to balance the need for label manipulation with performance considerations, particularly for frequently executed queries or those used in real-time dashboards.

