Strimzi
Table of Contents
- Introduction
- Prerequisites
- Steps to Follow
Introduction
Strimzi provides a Kubernetes operator for running Apache Kafka clusters on Kubernetes. It automates the deployment and management of Kafka components using custom resource definitions (CRDs). The operator handles cluster deployment, broker configurations, topic management, and user authentication while following Kubernetes-native practices. You retain full access to Kafka features while Strimzi manages the operational aspects through Kubernetes.
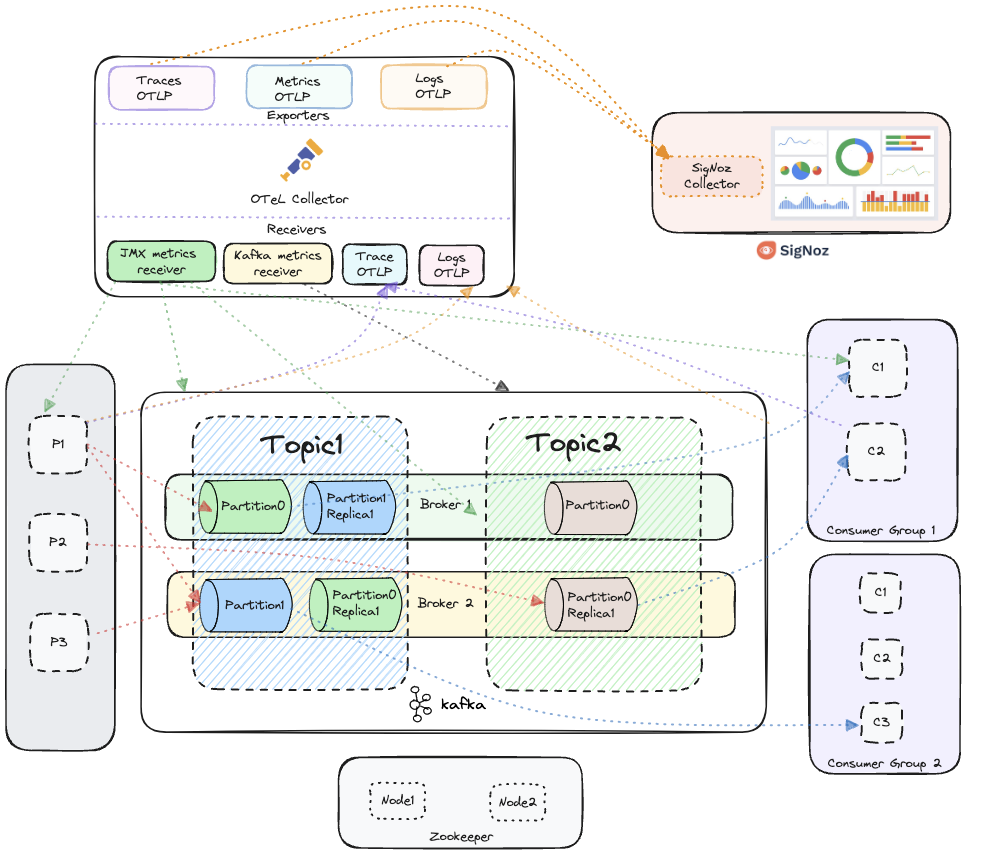
In this documentation, we will guide you through setting up Strimzi Kafka monitoring with OpenTelemetry and SigNoz. You'll learn how to instrument Strimzi Kafka's components—producers, consumers, topics, and brokers—so that you can collect key metrics, traces and logs. This will help you gain deep insights into the performance and behavior of your Strimzi Kafka cluster.

Kafka integrated with OpenTelemetry for collecting metrics, traces and logs, visualized in SigNoz
Prerequisites
Before you begin, ensure the following prerequisites are met:
- Java Development Kit (JDK): Ensure that JDK 8 or higher is installed on your system.
- Kubernetes Cluster: You will need a Kubernetes cluster to install Strimzi Kafka.
- Strimzi Operator: You will need to install the Strimzi operator in your Kubernetes cluster.
- Helm: You will need Helm to install charts in your Kubernetes cluster.
- Kafka Producer and Consumer Applications: You will need Kafka producer and consumer applications in Java (Support for other languages will be added soon).
- Kafka Client Library: Make sure the Kafka client libraries are included in your project. You can find the official Kafka client libraries from Apache here.
- OpenTelemetry Java Agent: Download the OpenTelemetry Java auto-instrumentation agent JAR. Follow the setup guide from the official OpenTelemetry documentation here or directly download the latest agent JAR from here.
Once these are set up, you will be ready to proceed with Kafka monitoring and instrumentation.
Steps to Follow
This guide follows these primary steps:
- Strimzi Operator Installation
- Deploy Kafka Cluster
- Configure Metrics Collection
- Deploy OpenTelemetry Collector
- Deploy Producer and Consumer Applications
Step 1: Strimzi Operator Installation
Install the Strimzi Kafka Operator using Helm:
helm install strimzi-cluster-operator oci://quay.io/strimzi-helm/strimzi-kafka-operator
Step 2: Deploy Kafka Cluster
Create a Kafka cluster with JMX metrics enabled. Apply the following configuration:
apiVersion: kafka.strimzi.io/v1beta2
kind: Kafka
metadata:
  name: signoz-demo-cluster
spec:
  kafka:
    version: 3.8.0
    replicas: 3
    listeners:
      - name: plain
        port: 9092
        type: internal
        tls: false
      - name: tls
        port: 9093
        type: internal
        tls: true
    config:
      offsets.topic.replication.factor: 3
      transaction.state.log.replication.factor: 3
      transaction.state.log.min.isr: 2
      default.replication.factor: 3
      min.insync.replicas: 2
      inter.broker.protocol.version: "3.8"
    storage:
      type: ephemeral
    metricsConfig:
      type: jmxPrometheusExporter
      valueFrom:
        configMapKeyRef:
          name: kafka-metrics
          key: kafka-metrics-config.yml
  zookeeper:
    replicas: 3
    storage:
      type: ephemeral
  entityOperator:
    topicOperator: {}
    userOperator: {}
Step 3: Configure Metrics Collection
Create and apply the Kafka metrics ConfigMap:
kind: ConfigMap
apiVersion: v1
metadata:
  name: kafka-metrics
  labels:
    app: strimzi
data:
  kafka-metrics-config.yml: |
    # See https://github.com/prometheus/jmx_exporter for more info about JMX Prometheus Exporter metrics
    lowercaseOutputName: true
    rules:
    # Special cases and very specific rules
    - pattern: kafka.server<type=(.+), name=(.+), clientId=(.+), topic=(.+), partition=(.*)><>Value
      name: kafka_server_$1_$2
      type: GAUGE
      labels:
        clientId: "$3"
        topic: "$4"
        partition: "$5"
    - pattern: kafka.server<type=(.+), name=(.+), clientId=(.+), brokerHost=(.+), brokerPort=(.+)><>Value
      name: kafka_server_$1_$2
      type: GAUGE
      labels:
        clientId: "$3"
        broker: "$4:$5"
    - pattern: kafka.server<type=(.+), cipher=(.+), protocol=(.+), listener=(.+), networkProcessor=(.+)><>connections
      name: kafka_server_$1_connections_tls_info
      type: GAUGE
      labels:
        cipher: "$2"
        protocol: "$3"
        listener: "$4"
        networkProcessor: "$5"
    - pattern: kafka.server<type=(.+), clientSoftwareName=(.+), clientSoftwareVersion=(.+), listener=(.+), networkProcessor=(.+)><>connections
      name: kafka_server_$1_connections_software
      type: GAUGE
      labels:
        clientSoftwareName: "$2"
        clientSoftwareVersion: "$3"
        listener: "$4"
        networkProcessor: "$5"
    - pattern: "kafka.server<type=(.+), listener=(.+), networkProcessor=(.+)><>(.+-total):"
      name: kafka_server_$1_$4
      type: COUNTER
      labels:
        listener: "$2"
        networkProcessor: "$3"
    - pattern: "kafka.server<type=(.+), listener=(.+), networkProcessor=(.+)><>(.+):"
      name: kafka_server_$1_$4
      type: GAUGE
      labels:
        listener: "$2"
        networkProcessor: "$3"
    - pattern: kafka.server<type=(.+), listener=(.+), networkProcessor=(.+)><>(.+-total)
      name: kafka_server_$1_$4
      type: COUNTER
      labels:
        listener: "$2"
        networkProcessor: "$3"
    - pattern: kafka.server<type=(.+), listener=(.+), networkProcessor=(.+)><>(.+)
      name: kafka_server_$1_$4
      type: GAUGE
      labels:
        listener: "$2"
        networkProcessor: "$3"
    # Some percent metrics use MeanRate attribute
    # Ex) kafka.server<type=(KafkaRequestHandlerPool), name=(RequestHandlerAvgIdlePercent)><>MeanRate
    - pattern: kafka.(\w+)<type=(.+), name=(.+)Percent\w*><>MeanRate
      name: kafka_$1_$2_$3_percent
      type: GAUGE
    # Generic gauges for percents
    - pattern: kafka.(\w+)<type=(.+), name=(.+)Percent\w*><>Value
      name: kafka_$1_$2_$3_percent
      type: GAUGE
    - pattern: kafka.(\w+)<type=(.+), name=(.+)Percent\w*, (.+)=(.+)><>Value
      name: kafka_$1_$2_$3_percent
      type: GAUGE
      labels:
        "$4": "$5"
    # Generic per-second counters with 0-2 key/value pairs
    - pattern: kafka.(\w+)<type=(.+), name=(.+)PerSec\w*, (.+)=(.+), (.+)=(.+)><>Count
      name: kafka_$1_$2_$3_total
      type: COUNTER
      labels:
        "$4": "$5"
        "$6": "$7"
    - pattern: kafka.(\w+)<type=(.+), name=(.+)PerSec\w*, (.+)=(.+)><>Count
      name: kafka_$1_$2_$3_total
      type: COUNTER
      labels:
        "$4": "$5"
    - pattern: kafka.(\w+)<type=(.+), name=(.+)PerSec\w*><>Count
      name: kafka_$1_$2_$3_total
      type: COUNTER
    # Generic gauges with 0-2 key/value pairs
    - pattern: kafka.(\w+)<type=(.+), name=(.+), (.+)=(.+), (.+)=(.+)><>Value
      name: kafka_$1_$2_$3
      type: GAUGE
      labels:
        "$4": "$5"
        "$6": "$7"
    - pattern: kafka.(\w+)<type=(.+), name=(.+), (.+)=(.+)><>Value
      name: kafka_$1_$2_$3
      type: GAUGE
      labels:
        "$4": "$5"
    - pattern: kafka.(\w+)<type=(.+), name=(.+)><>Value
      name: kafka_$1_$2_$3
      type: GAUGE
    # Emulate Prometheus 'Summary' metrics for the exported 'Histogram's.
    # Note that these are missing the '_sum' metric!
    - pattern: kafka.(\w+)<type=(.+), name=(.+), (.+)=(.+), (.+)=(.+)><>Count
      name: kafka_$1_$2_$3_count
      type: COUNTER
      labels:
        "$4": "$5"
        "$6": "$7"
    - pattern: kafka.(\w+)<type=(.+), name=(.+), (.+)=(.*), (.+)=(.+)><>(\d+)thPercentile
      name: kafka_$1_$2_$3
      type: GAUGE
      labels:
        "$4": "$5"
        "$6": "$7"
        quantile: "0.$8"
    - pattern: kafka.(\w+)<type=(.+), name=(.+), (.+)=(.+)><>Count
      name: kafka_$1_$2_$3_count
      type: COUNTER
      labels:
        "$4": "$5"
    - pattern: kafka.(\w+)<type=(.+), name=(.+), (.+)=(.*)><>(\d+)thPercentile
      name: kafka_$1_$2_$3
      type: GAUGE
      labels:
        "$4": "$5"
        quantile: "0.$6"
    - pattern: kafka.(\w+)<type=(.+), name=(.+)><>Count
      name: kafka_$1_$2_$3_count
      type: COUNTER
    - pattern: kafka.(\w+)<type=(.+), name=(.+)><>(\d+)thPercentile
      name: kafka_$1_$2_$3
      type: GAUGE
      labels:
        quantile: "0.$4"
    # KRaft overall related metrics
    # distinguish between always increasing COUNTER (total and max) and variable GAUGE (all others) metrics
    - pattern: "kafka.server<type=raft-metrics><>(.+-total|.+-max):"
      name: kafka_server_raftmetrics_$1
      type: COUNTER
    - pattern: "kafka.server<type=raft-metrics><>(.+):"
      name: kafka_server_raftmetrics_$1
      type: GAUGE
    # KRaft "low level" channels related metrics
    # distinguish between always increasing COUNTER (total and max) and variable GAUGE (all others) metrics
    - pattern: "kafka.server<type=raft-channel-metrics><>(.+-total|.+-max):"
      name: kafka_server_raftchannelmetrics_$1
      type: COUNTER
    - pattern: "kafka.server<type=raft-channel-metrics><>(.+):"
      name: kafka_server_raftchannelmetrics_$1
      type: GAUGE
    # Broker metrics related to fetching metadata topic records in KRaft mode
    - pattern: "kafka.server<type=broker-metadata-metrics><>(.+):"
      name: kafka_server_brokermetadatametrics_$1
      type: GAUGE
Apply the ConfigMap:
kubectl apply -f kafka-metrics-config.yaml
Step 4: Deploy OpenTelemetry Collector
Install the SigNoz Kubernetes collector with automatic Strimzi discovery:
global:
  cloud: <aws, azure, gcp, others>
  clusterName: signoz-demo-cluster
  deploymentEnvironment: production
otelCollectorEndpoint: <Collector Endpoint>
otelInsecure: false
signozApiKey: <API Key Here>
presets:
  otlpExporter:
    enabled: true
  loggingExporter:
    enabled: false
otelDeployment:
  config:
    receivers:
      kafkametrics:
        collection_interval: 10s
        cluster_alias: signoz-demo-cluster1
        brokers:
          - signoz-demo-cluster1-kafka-bootstrap:9092
        protocol_version: 3.0.0
        scrapers:
          - brokers
          - topics
          - consumers
      prometheus:
        config:
          scrape_configs:
            - job_name: 'strimzi-pods'
              scrape_interval: 10s
              kubernetes_sd_configs:
              - role: pod
              relabel_configs:
              - source_labels: [__meta_kubernetes_pod_label_strimzi_io_kind]
                regex: Kafka
                action: keep
Deploy the collector:
helm install my-release signoz/k8s-infra -f ./signoz-k8.yml
Step 5: Deploy Producer and Consumer Applications
Deploy the Kafka producer and consumer applications with OpenTelemetry instrumentation:
Compile your Java producer and consumer applications: Ensure your producer and consumer apps are compiled and ready to run.
Run Producer App with Java Agent:
java -javaagent:/path/to/opentelemetry-javaagent.jar \
     -Dotel.service.name=producer-svc \
     -Dotel.traces.exporter=otlp \
     -Dotel.metrics.exporter=otlp \
     -Dotel.logs.exporter=otlp \
     -jar /path/to/your/producer.jar
Run Consumer App with Java Agent:
java -javaagent:/path/to/opentelemetry-javaagent.jar \
     -Dotel.service.name=consumer-svc \
     -Dotel.traces.exporter=otlp \
     -Dotel.metrics.exporter=otlp \
     -Dotel.logs.exporter=otlp \
     -Dotel.instrumentation.kafka.producer-propagation.enabled=true \
     -Dotel.instrumentation.kafka.experimental-span-attributes=true \
     -Dotel.instrumentation.kafka.metric-reporter.enabled=true \
     -jar /path/to/your/consumer.jar
Example: Deploying Sample Kafka Producer and Consumer Applications with OpenTelemetry Java Agent
# Producer Deployment
apiVersion: apps/v1
kind: Deployment
metadata:
  name: kafka-producer1
spec:
  replicas: 1
  selector:
    matchLabels:
      app: kafka-producer1
  template:
    metadata:
      labels:
        app: kafka-producer1
    spec:
      containers:
      - name: producer
        image: jaikanthjay46/kafka-consumer-test:latest
        env:
        - name: BOOTSTRAP_SERVERS
          value: "signoz-demo-cluster1-kafka-bootstrap:9092"
        - name: TOPIC
          value: "topic1"
        - name: PARTITION_KEY
          value: "key1"
        - name: DELAY
          value: "10"
        - name: OTEL_SERVICE_NAME
          value: "producer-svc1"
        - name: OTEL_TRACES_EXPORTER
          value: "otlp"
        - name: OTEL_METRICS_EXPORTER
          value: "otlp"
        - name: OTEL_LOGS_EXPORTER
          value: "otlp"
        - name: OTEL_EXPORTER_OTLP_LOGS_ENDPOINT
          value: "http://my-release-k8s-infra-otel-agent:4318/v1/logs"
        - name: OTEL_EXPORTER_OTLP_METRICS_ENDPOINT
          value: "http://my-release-k8s-infra-otel-agent:4318/v1/metrics"
        - name: OTEL_EXPORTER_OTLP_TRACES_ENDPOINT
          value: "http://my-release-k8s-infra-otel-agent:4318/v1/traces"
---
# Consumer Deployment
apiVersion: apps/v1
kind: Deployment
metadata:
  name: kafka-consumer1
spec:
  replicas: 1
  selector:
    matchLabels:
      app: kafka-consumer1
  template:
    metadata:
      labels:
        app: kafka-consumer1
    spec:
      containers:
      - name: consumer
        image: jaikanthjay46/kafka-consumer-test:latest
        env:
        - name: BOOTSTRAP_SERVERS
          value: "signoz-demo-cluster1-kafka-bootstrap:9092"
        - name: CONSUMER_GROUP
          value: "cg1"
        - name: TOPIC
          value: "topic1"
        - name: OTEL_SERVICE_NAME
          value: "consumer-svc"
        - name: OTEL_TRACES_EXPORTER
          value: "none"
        - name: OTEL_METRICS_EXPORTER
          value: "none"
        - name: OTEL_LOGS_EXPORTER
          value: "none"
        - name: OTEL_EXPORTER_OTLP_LOGS_ENDPOINT
          value: "http://my-release-k8s-infra-otel-agent:4318/v1/logs"
        - name: OTEL_EXPORTER_OTLP_METRICS_ENDPOINT
          value: "http://my-release-k8s-infra-otel-agent:4318/v1/metrics"
        - name: OTEL_EXPORTER_OTLP_TRACES_ENDPOINT
          value: "http://my-release-k8s-infra-otel-agent:4318/v1/traces"
Apply the deployments:
kubectl apply -f kafka-applications.yaml
Please take note of otel service name my-release-k8s-infra-otel-agent in the above yaml file, you will need to replace it with your otel service name. It's of the format <helm-release-name>-k8s-infra-otel-agent.
Continue to visualize your data in SigNoz as described in the previous sections.
Visualize data in SigNoz
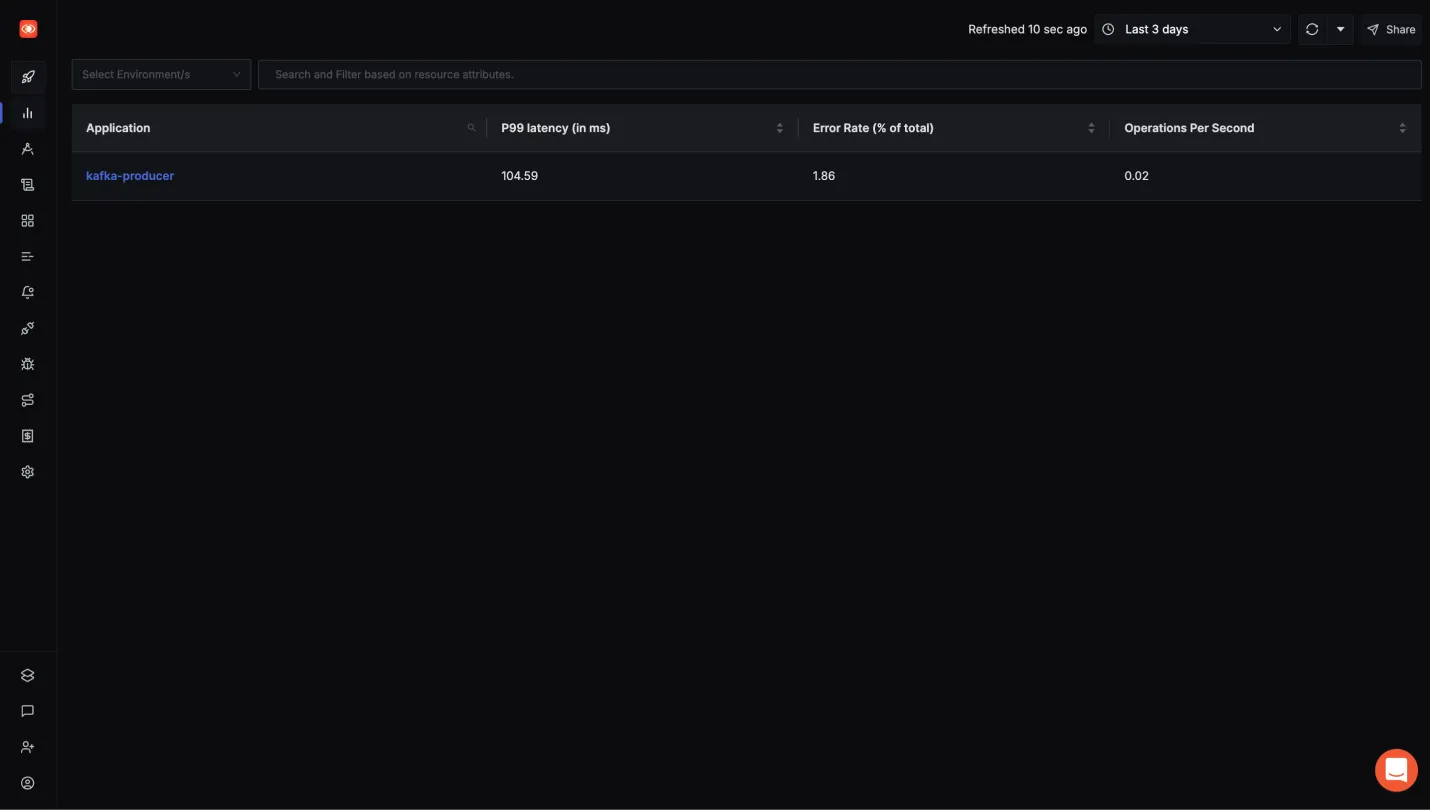
To see your Producer and Consumer app traces:
- Head over to Services tab in your SigNoz instance.
- You should be able to see your apps in the list along with some application metrics.
- Click on the service of your choice to see more detailed application metrics and related traces.

Kafka Producer app in Services tab of SigNoz
To see the Kafka Metrics:
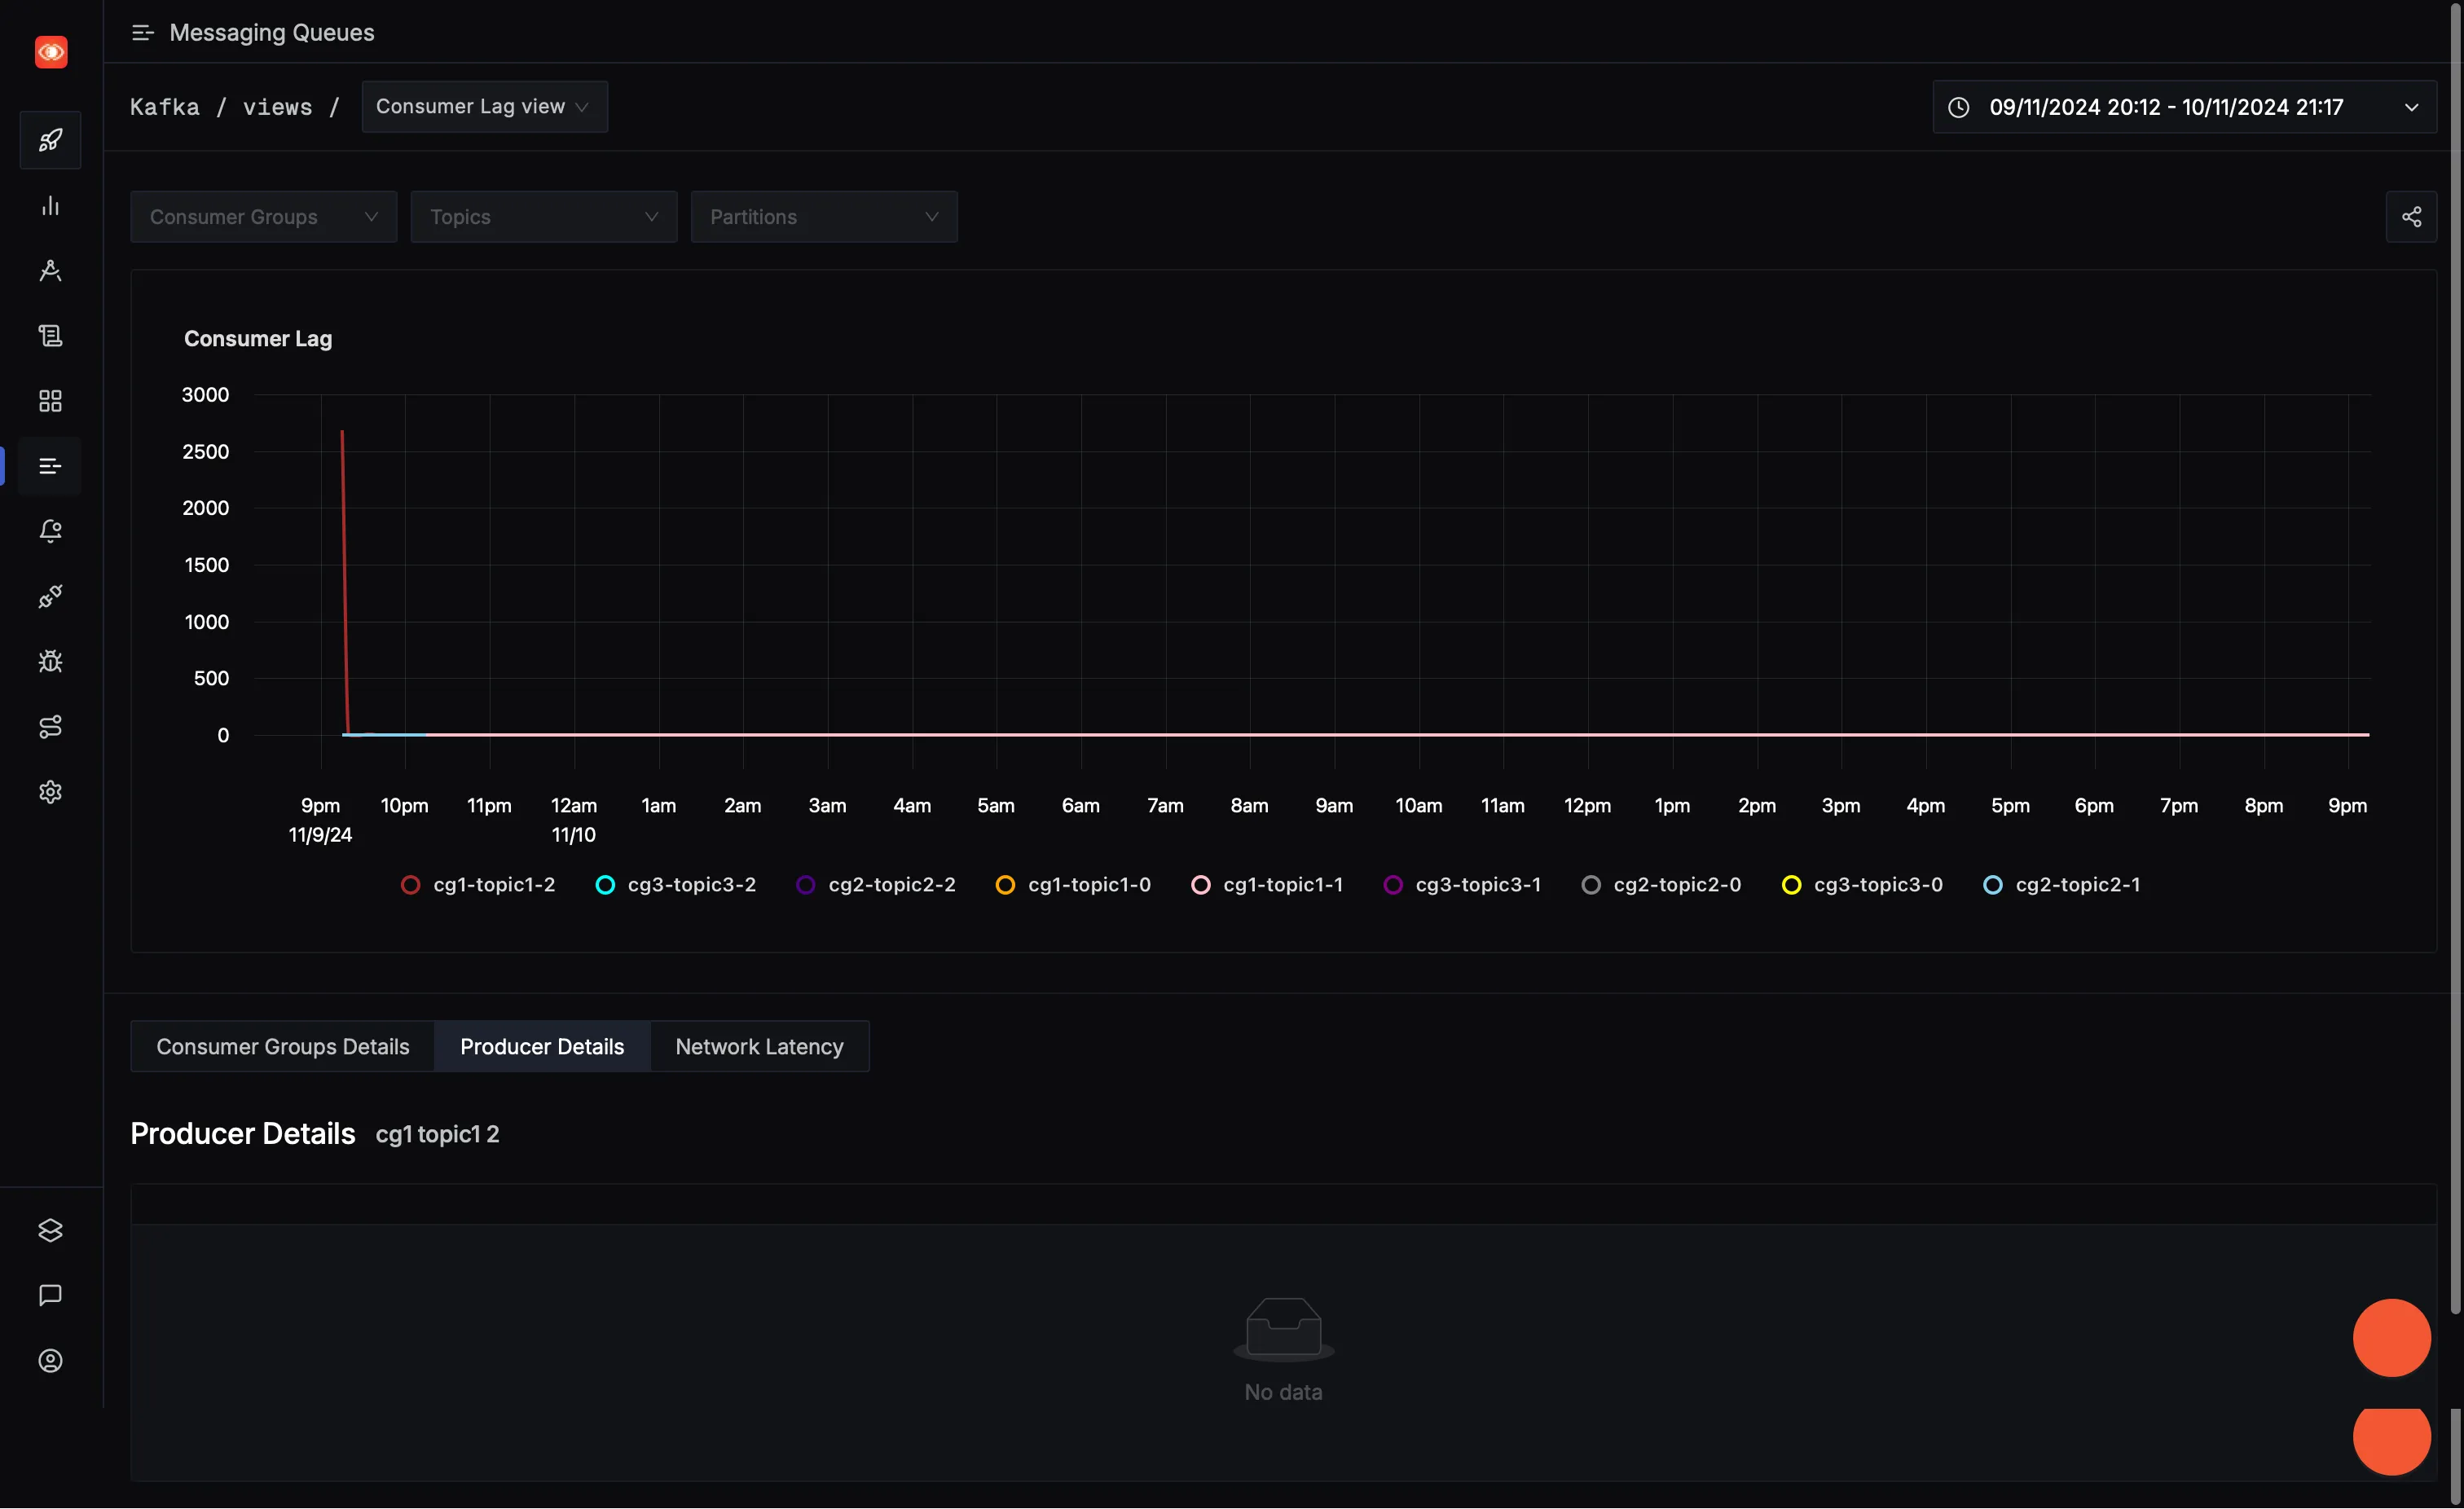
The messaging queues tab in SigNoz only works when both the producer and consumer applications are instrumented with SigNoz, along with the Kafka cluster itself.
- Head over to Messaging Queues tab in your SigNoz instance.
- You will get different Options like Consumer Lag View etc., to see various kafka related metrics.

Messaging Queues tab in SigNoz
