Monitor MSK Service
Table of Contents
Introduction
Amazon MSK is a managed service that runs Apache Kafka on AWS. It handles the operational complexities of running Kafka clusters while giving you full access to native Kafka features. The service automates broker management, cluster scaling, and backups. You retain control over your Kafka applications and data while AWS manages the underlying infrastructure.
In this documentation, we will guide you through setting up Amazon MSK monitoring with OpenTelemetry and SigNoz. You'll learn how to instrument MSK's components—producers, consumers, topics, and brokers—so that you can collect key metrics, traces and logs. This will help you gain deep insights into the performance and behavior of your MSK cluster.

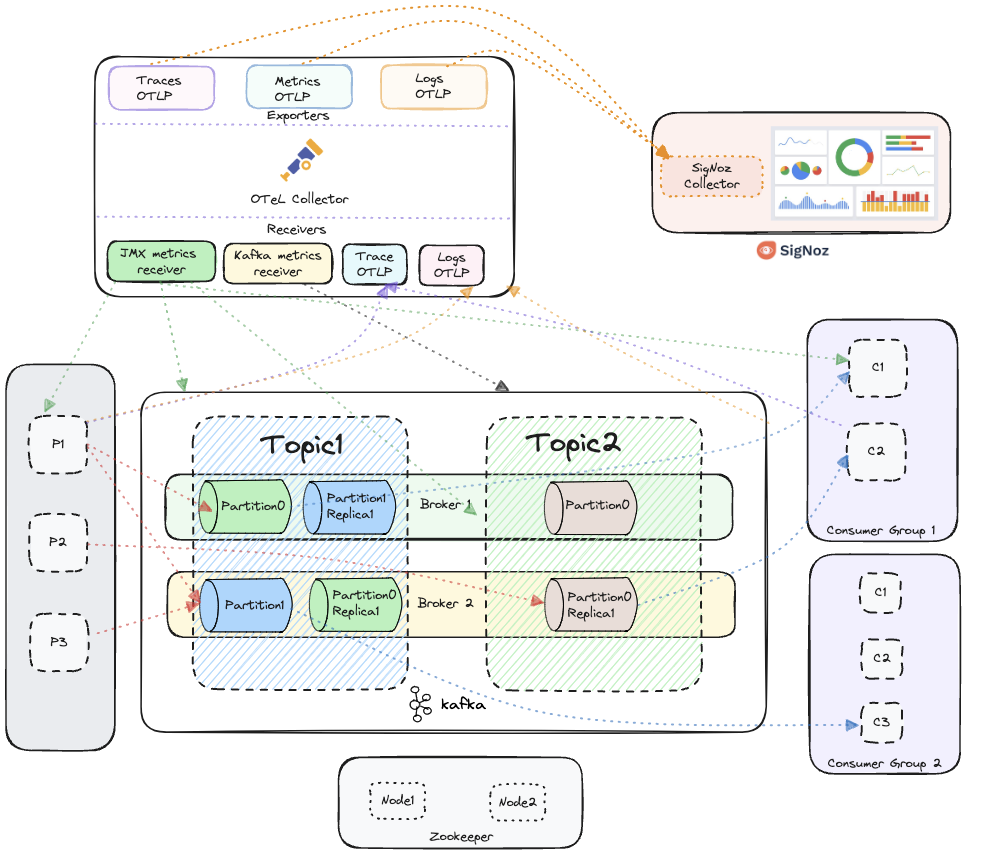
Kafka integrated with OpenTelemetry for collecting metrics, traces and logs, visualized in SigNoz
Prerequisites
Before you begin, ensure the following prerequisites are met:
- Java Development Kit (JDK): Ensure that JDK 8 or higher is installed on your system.
- Amazon MSK: You will need an Amazon MSK cluster to monitor. If you don't have one, you can create one using the Amazon MSK console.
- Kafka Producer and Consumer Applications: You will need Kafka producer and consumer applications in Java (Support for other languages will be added soon).
- Kafka Client Library: Make sure the Kafka client libraries are included in your project. You can find the official Kafka client libraries from Apache here.
- OpenTelemetry Java Agent: Download the OpenTelemetry Java auto-instrumentation agent JAR. Follow the setup guide from the official OpenTelemetry documentation here or directly download the latest agent JAR from here.
Once these are set up, you will be ready to proceed with Kafka monitoring and instrumentation.
Steps to Follow
This guide follows these primary steps:
- MSK Setup
- OpenTelemetry Java Agent Installation
- Run OpenTelemetry Collector
- Java Producer-Consumer App Setup
- Visualise data in SigNoz
Step 1: Enable Monitoring
- Go to the Amazon MSK console
- Select the cluster
- Click on the
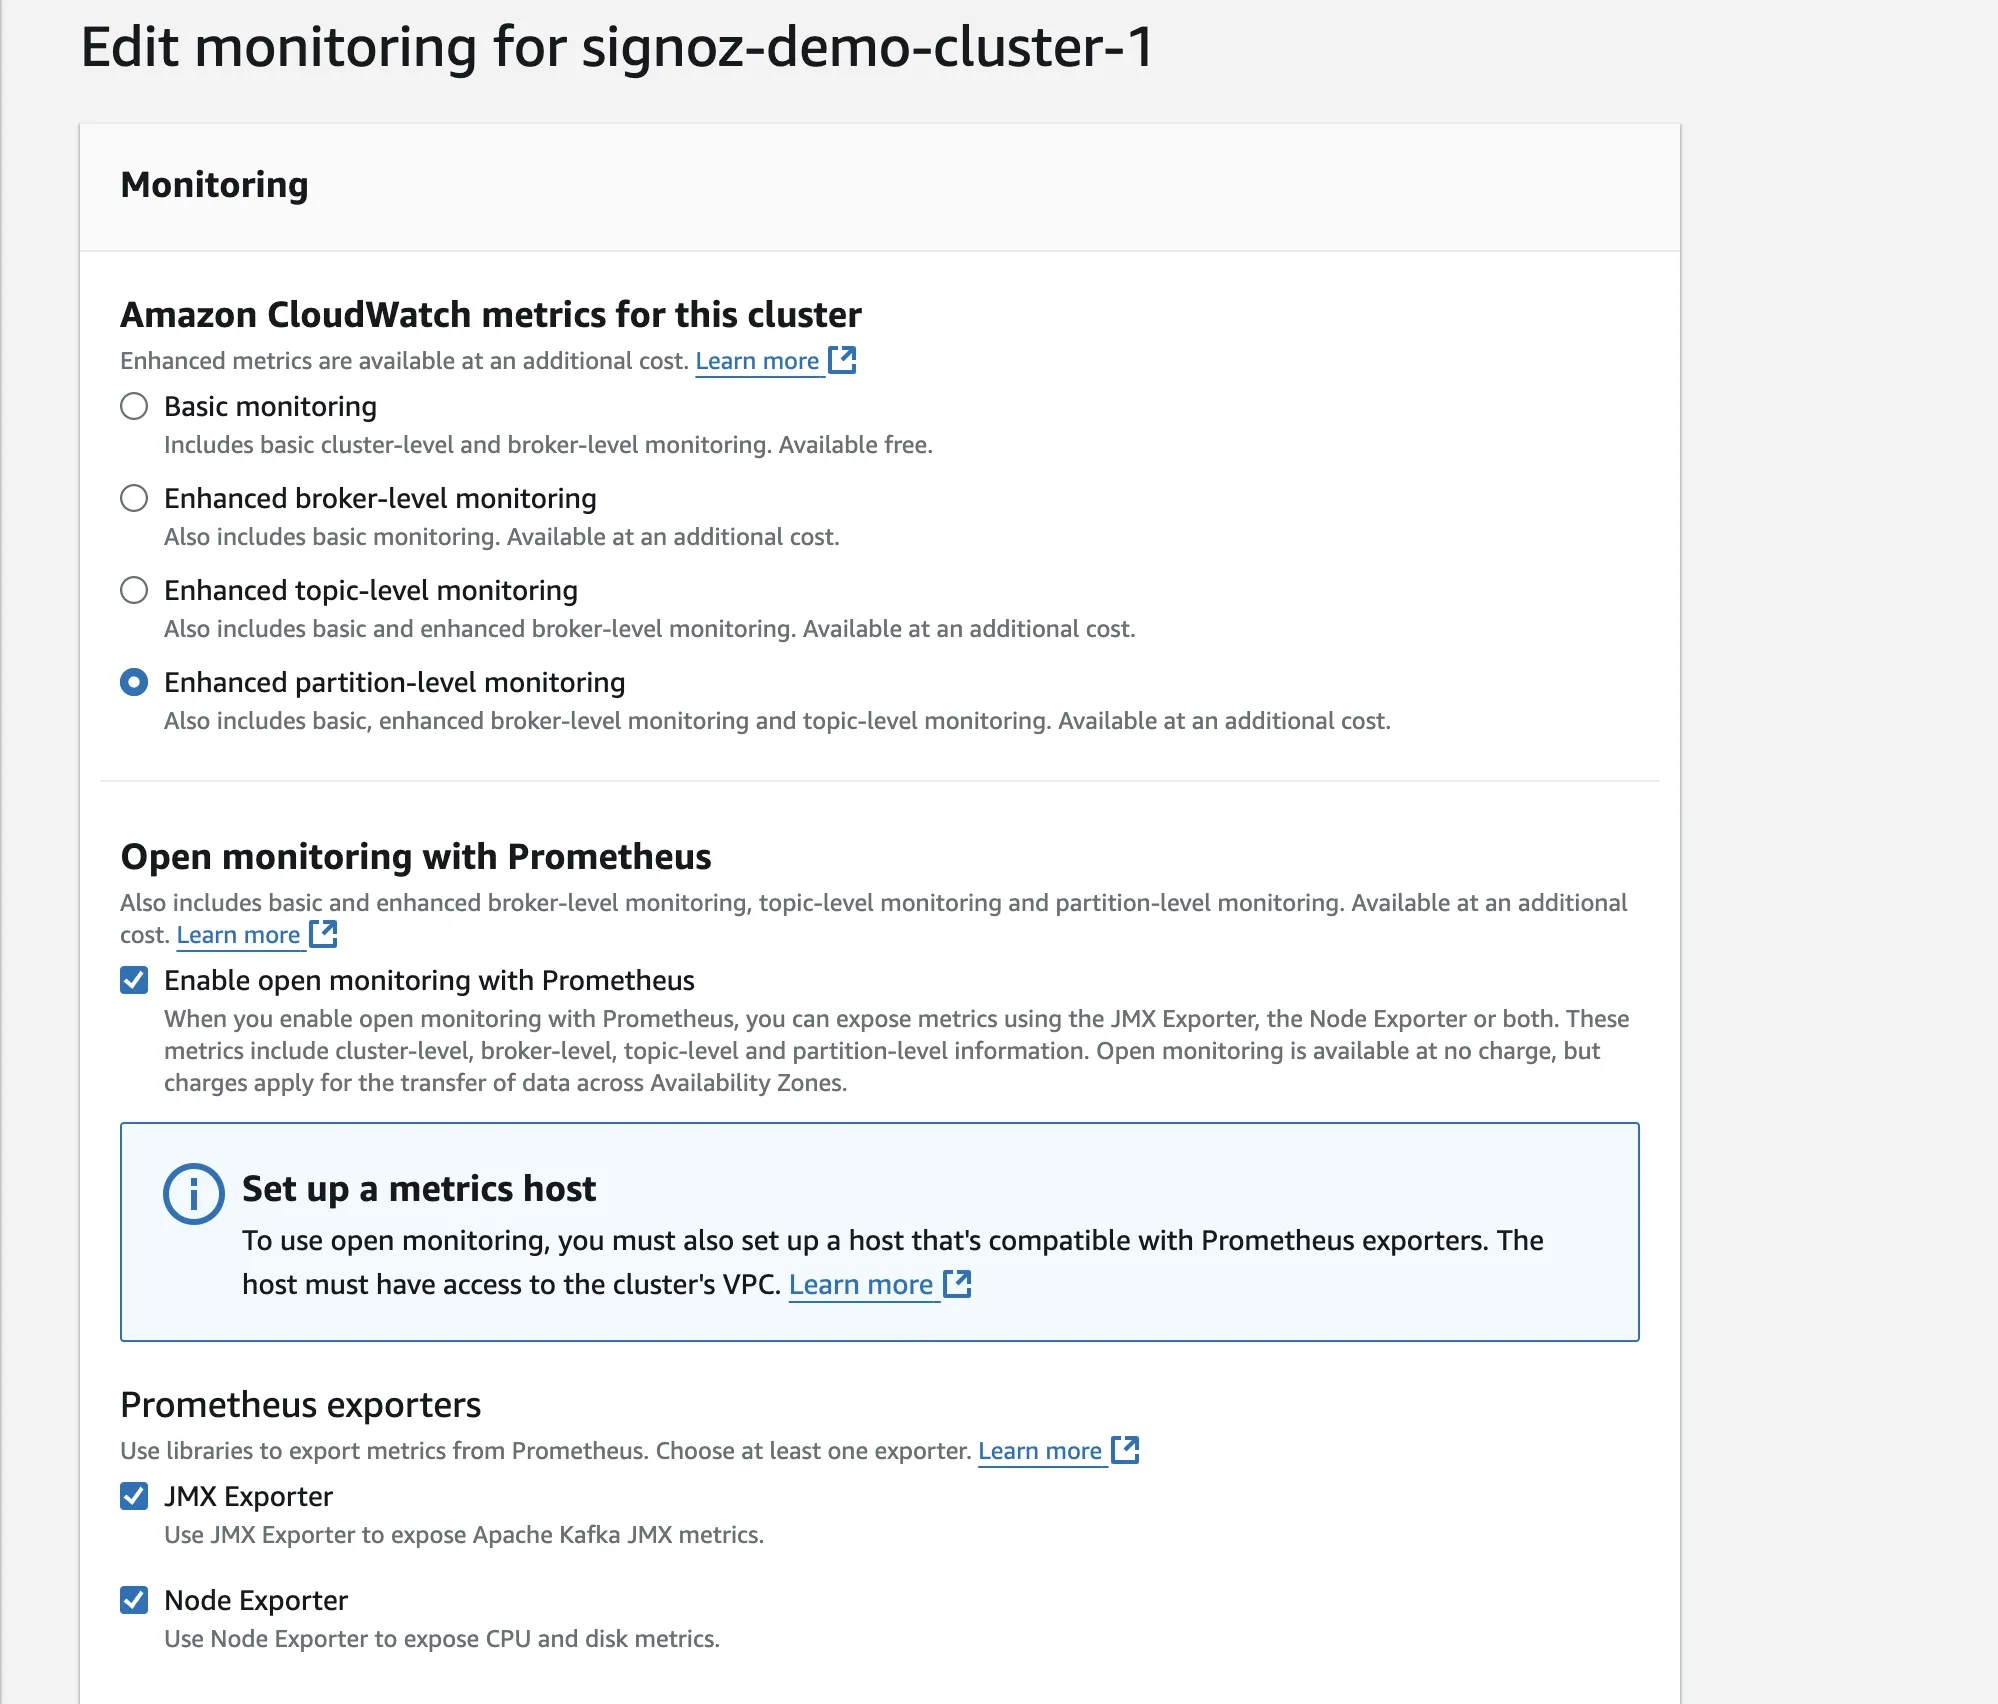
Actions>Edit Monitoring - Configure the following settings as in the screenshot below:

MSK Monitoring Settings
Step 2: Configure OpenTelemetry Collector
Create a configuration file for the OpenTelemetry Collector:
receivers:
  prometheus:
    config:
      scrape_configs:
        - job_name: 'broker'
          file_sd_configs:
          - files:
            - 'targets.json'

exporters:
  otlp:
    endpoint: "<YOUR_SIGNOZ_CLOUD_URL>"
    tls:
      insecure: false
    headers:
      "signoz-access-token": "<SIGNOZ_INGESTION_KEY>"

service:
  pipelines:
    metrics:
      receivers: [prometheus]
      processors: [batch]
      exporters: [otlp]
Targets JSON File
The targets.json file contains the list of brokers and their ports. You can get all the broker dns by:
- Navigating to the Amazon MSK console
- Selecting the cluster
- Clicking on the
Propertiestab
You will find the Broker DNS under the Broker details section in the Endpoints column.
[
  {
    "labels": {
      "job": "jmx"
    },
    "targets": [
      "broker_dns_1:11001",
      "broker_dns_2:11001",
      .
      .
      .
      "broker_dns_N:11001"
    ]
  },
  {
    "labels": {
      "job": "node"
    },
    "targets": [
      "broker_dns_1:11002",
      "broker_dns_2:11002",
      .
      .
      .
      "broker_dns_N:11002"
    ]
  }
]
Step 3: Run OpenTelemetry Collector
Create an EC2 instance in the same VPC as your MSK cluster.
- Install the OpenTelemetry Collector: You can follow this doc to download the binary for your Operating System.
Place the binary in the root of your project directory.
- Start the collector:
./otelcol --config config.yaml
Step 4: Deploy Applications
Compile your Java producer and consumer applications: Ensure your producer and consumer apps are compiled and ready to run.
Run Producer App with Java Agent:
java -javaagent:/path/to/opentelemetry-javaagent.jar \
     -Dotel.service.name=producer-svc \
     -Dotel.traces.exporter=otlp \
     -Dotel.metrics.exporter=otlp \
     -Dotel.logs.exporter=otlp \
     -jar /path/to/your/producer.jar
Run Consumer App with Java Agent:
java -javaagent:/path/to/opentelemetry-javaagent.jar \
     -Dotel.service.name=consumer-svc \
     -Dotel.traces.exporter=otlp \
     -Dotel.metrics.exporter=otlp \
     -Dotel.logs.exporter=otlp \
     -Dotel.instrumentation.kafka.producer-propagation.enabled=true \
     -Dotel.instrumentation.kafka.experimental-span-attributes=true \
     -Dotel.instrumentation.kafka.metric-reporter.enabled=true \
     -jar /path/to/your/consumer.jar
Visualize data in SigNoz
To see your Producer and Consumer app traces:
- Head over to Services tab in your SigNoz instance.
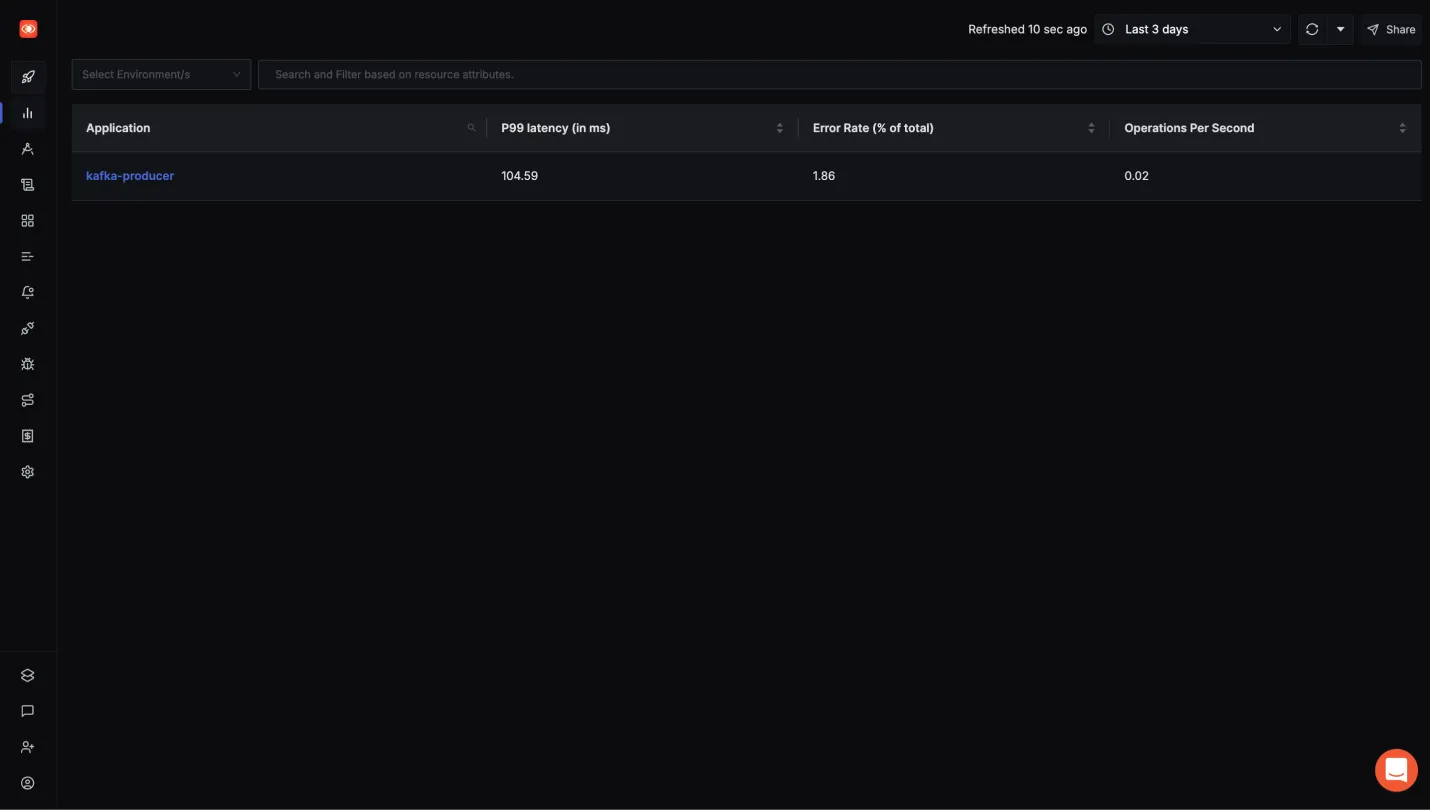
- You should be able to see your apps in the list along with some application metrics.
- Click on the service of your choice to see more detailed application metrics and related traces.

Kafka Producer app in Services tab of SigNoz
To see the Kafka Metrics:
The messaging queues tab in SigNoz only works when both the producer and consumer applications are instrumented with SigNoz, along with the Kafka cluster itself.
- Head over to Messaging Queues tab in your SigNoz instance.
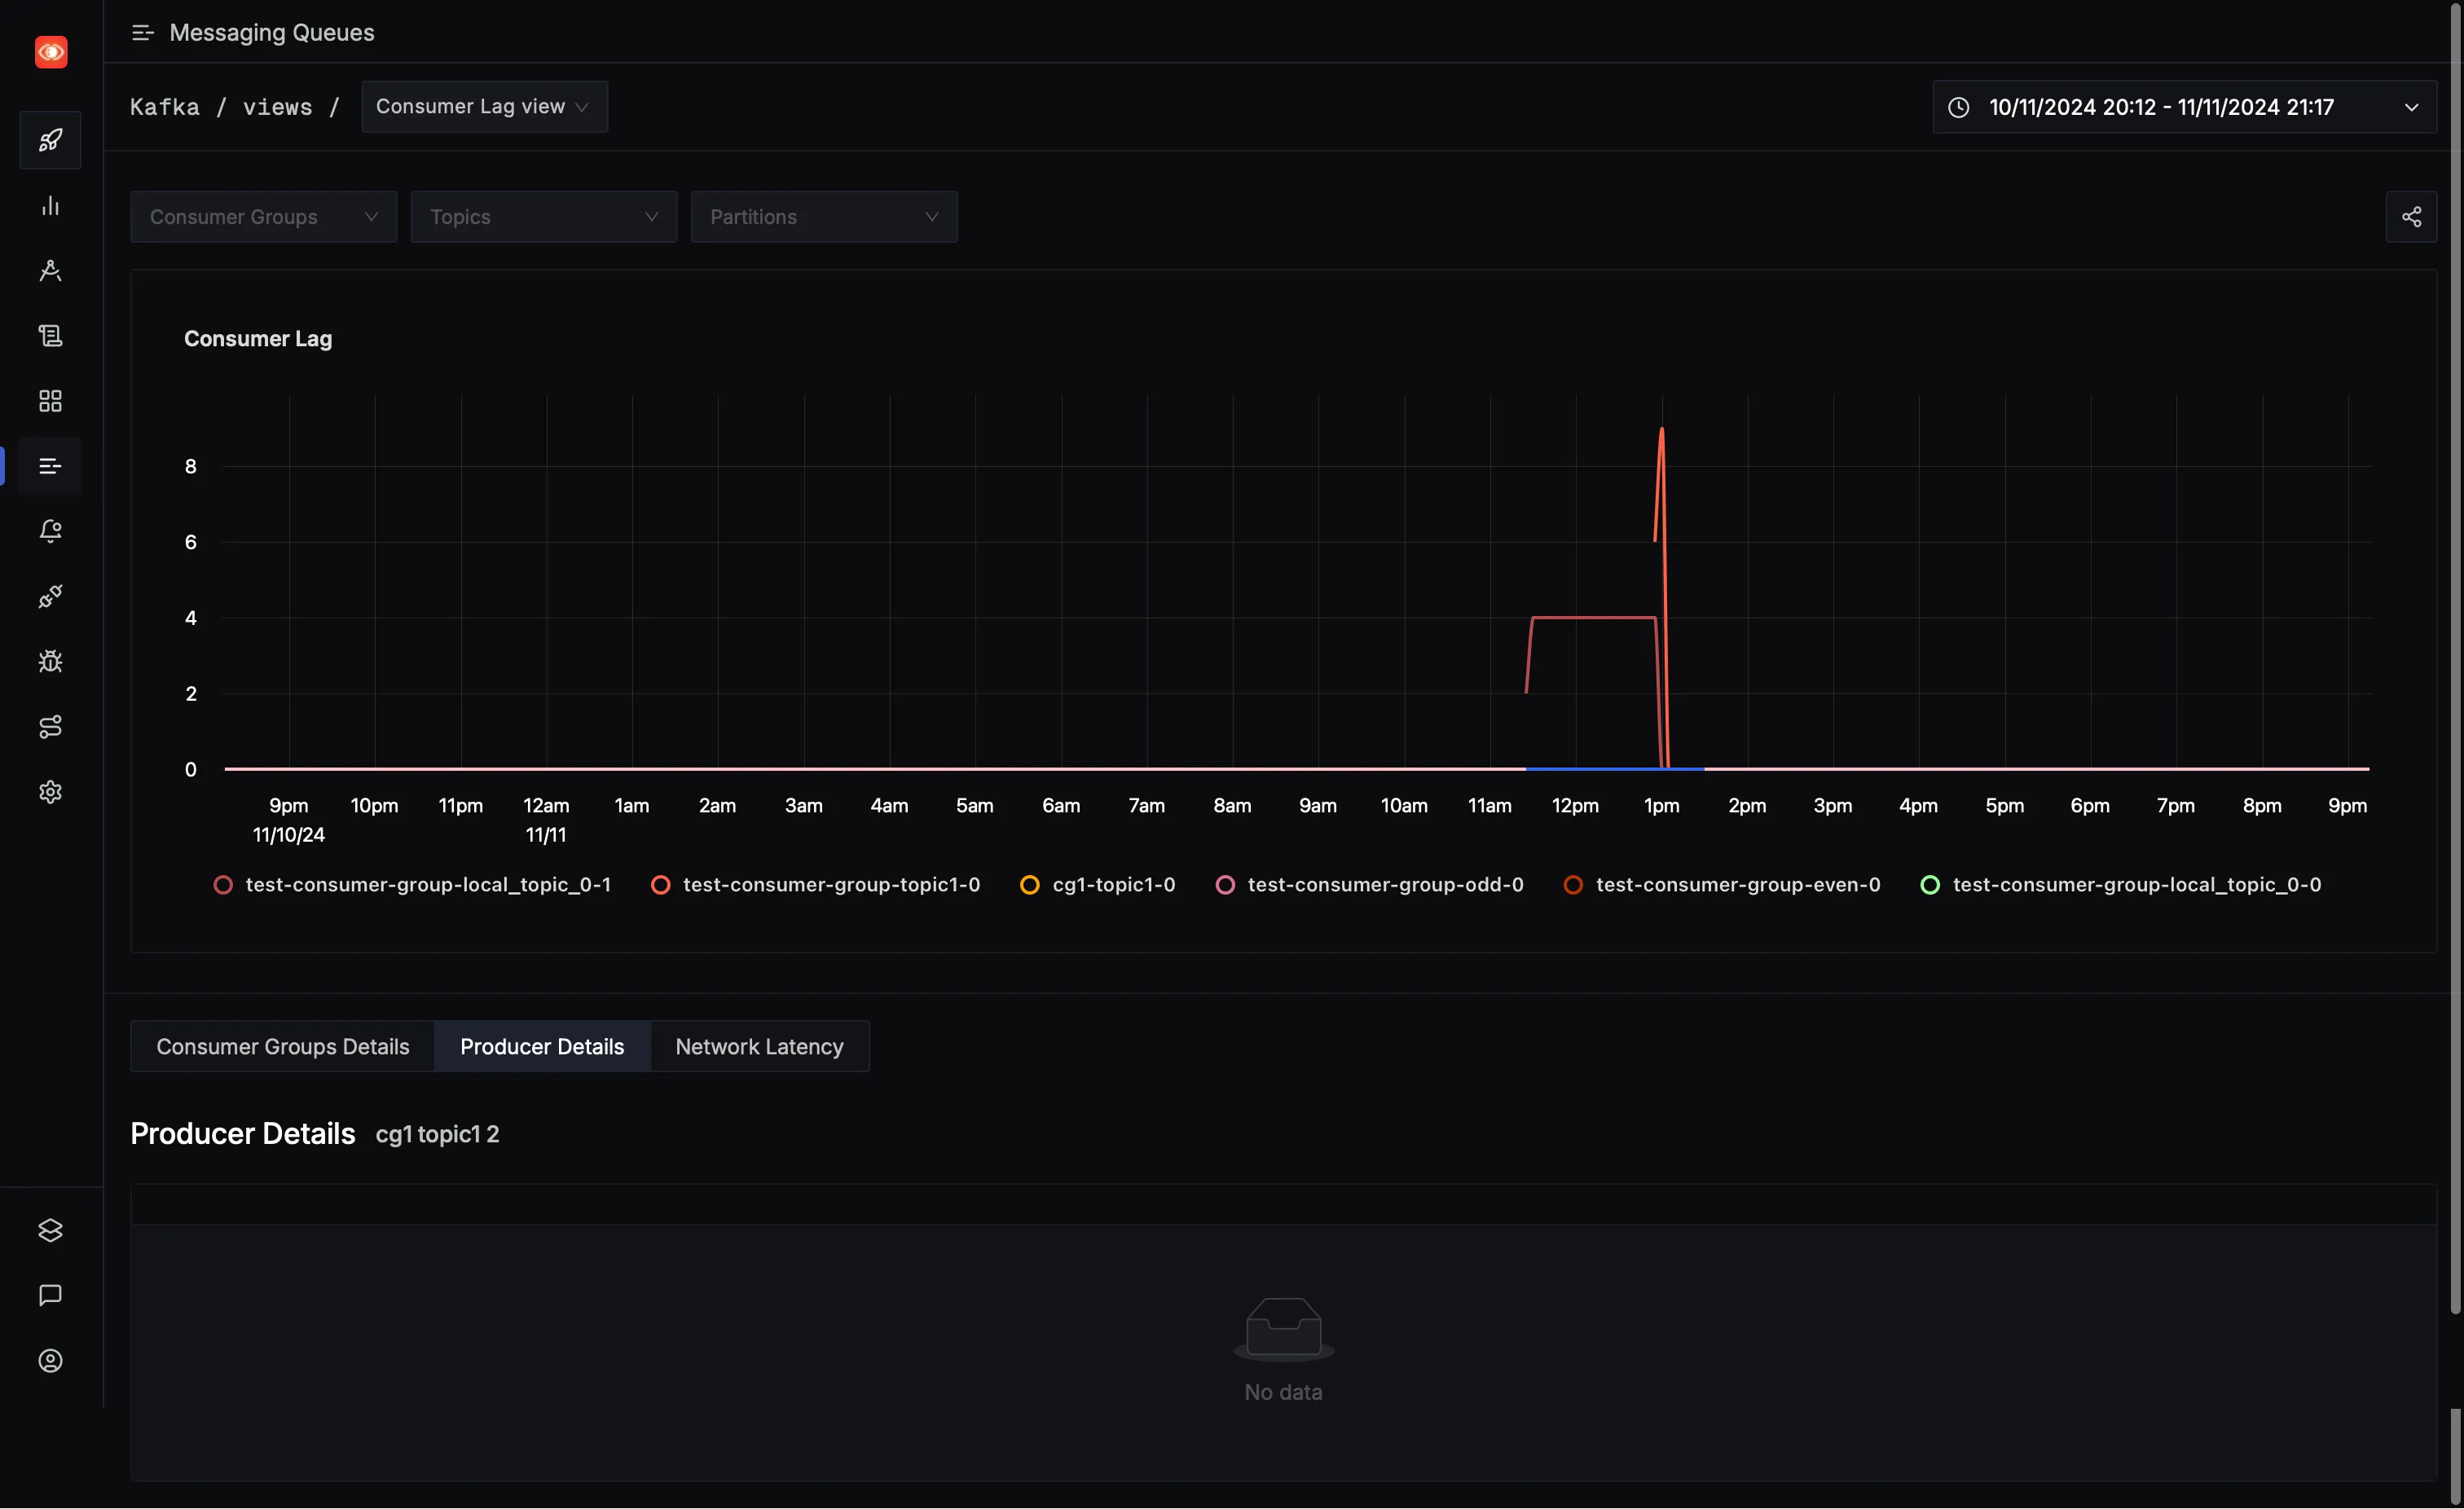
- You will get different Options like Consumer Lag View etc., to see various kafka related metrics.

Messaging Queues tab in SigNoz
